Last week, new results from the National Assessment of Educational Progress (NAEP), also known as the Nation’s Report Card, showed Tennessee students doubling the average national growth in both fourth- and eighth-grade science, propelling Tennessee’s ranking into the top half of all states.
Why is this so important? As a subject area, science is uniquely cross-cutting, involving critical thinking, mathematics, understanding of the physical world, and students’ imagination. Because it compels students to draw on several bodies of knowledge–often in the context of real-world challenges–science matters (a lot).
Six years ago, Tennessee students’ ranked 24th and 26th among participating states on fourth- and eighth-grade NAEP science assessments. Recent release of the 2015 NAEP results shows Tennessee students accelerating to 19th and 21st in the country in respective grades. This rise can be attributed, in large part, to incredible gains posted by historically underserved student groups, including economically disadvantaged students, students of color, English language learners, and students with disabilities.
What NAEP Tells Us
The NAEP science assessment tests student understanding of how scientific knowledge is used by measuring whether, and how, students apply that knowledge. For example, NAEP looks at student understanding and use of scientific principles, analysis and application of scientific investigation, and use of science-based processes for determining solutions to real-world problems. The NAEP science exam is organized around physical science, life science, and earth and space science.
Broad Gains
Comparing Tennessee students’ average scale scores on the science assessment to national figures, it is clear that gains are occurring across student subgroups (highest achievable scale score is 300). Figure 1 compares students who are economically disadvantaged (ED) to those who aren’t both in Tennessee and nationwide. In 2015, both ED and non-ED students in Tennessee surpassed the national average score for their subgroup, and what is more, ED students grew faster than their better-off peers in both fourth grade and eighth grade.
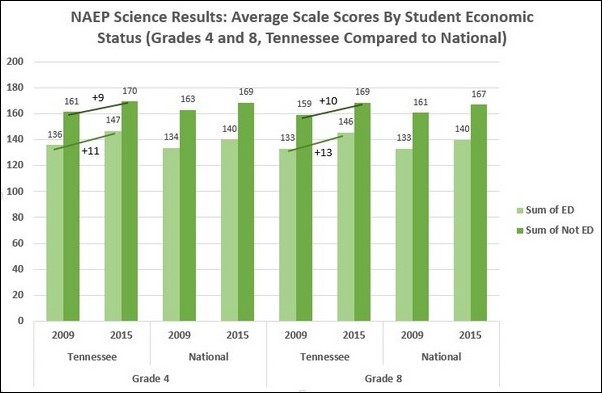
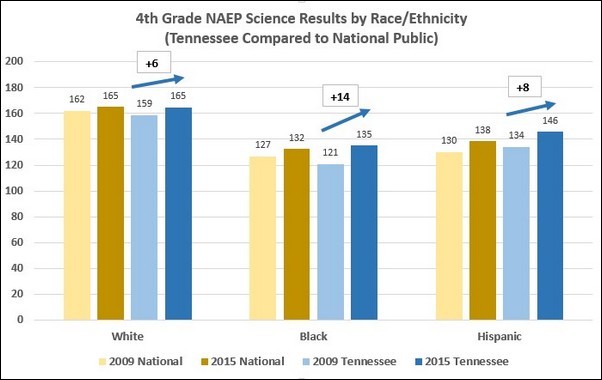
Figure 2 provides data on student performance by race/ethnicity. The results are heartening; all major student subgroups posted gains between 2009 and 2015, while historically underserved students catapulted ahead–black students posting an impressive 14-point gain, and Hispanic students posting an 8-point gain. (Other subgroups, such as Asian/Pacific Islander, American Indian/Alaska Native, two or more races, etc., did not meet minimum number thresholds to be included in NAEP study results). This widespread growth across demographics means that Tennessee students have either matched or surpassed the national average for their subgroup.
These trends are also observable in the growing population of English language learners (ELLs) in Tennessee, who now comprise about 5 percent of students enrolled in the state’s public schools. Figure 3 shows fourth-grade ELLs in Tennessee achieving an enormous gain of 17 points, on average between 2009 and 2015, growing at double the rate of their non-ELL peers.

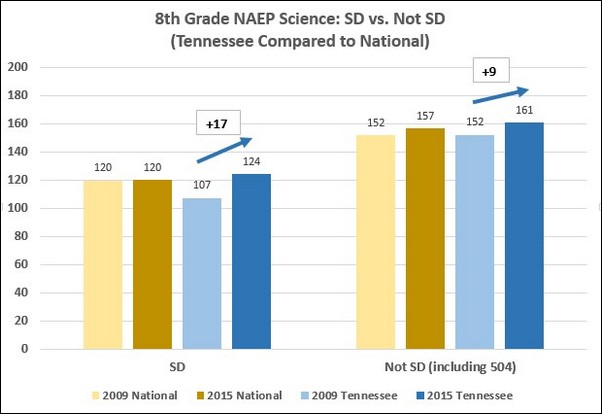
Students with disabilities also posted big gains, with eighth-grade students achieving nearly double the growth of students without disabilities and outpacing the national average in both cases. See Figure 4.
When breaking down results by gender, girls outpaced boys in average scale scores on the science assessment, marking a symbolic shift in a field historically dominated by males. It is clear from these data that Tennessee school leaders and teachers are better serving all students in their science learning. However, much work remains to further close large gaps between subgroups while continuing to grow all students.
Regional Rankings and Growth
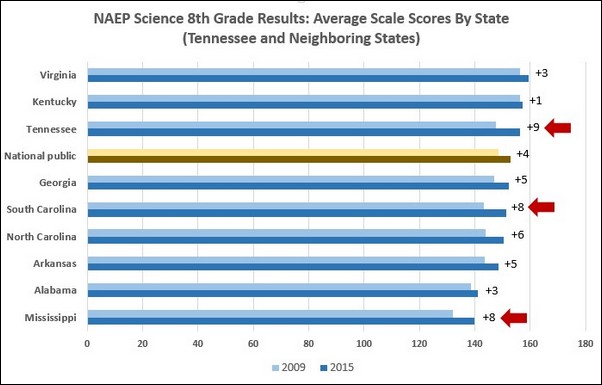
Such widespread growth across student subgroups culminates in impressive state gains. While important to note national rankings, a look at regional trends can inform our thinking about long-term postsecondary and career-going possibilities for our state’s students in comparison to their neighbors. Take a look at Figure 5, which shows Tennessee eighth-graders growing faster than all of their peers in the south. Only South Carolina and Mississippi posted score increases similar to Tennessee. This launches Tennessee to a ranking of third out of eight neighboring states, and above the national average. Similar results were seen in fourth grade.
Growth versus Proficiency
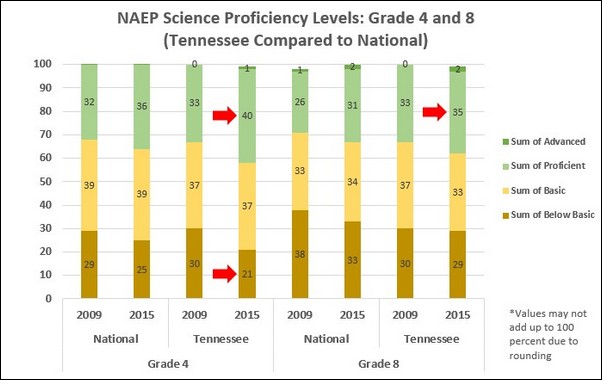
While Tennessee students have grown faster than nearly all of their peers in the nation on science performance, there is still much more work to be done. Figure 6 shows the proficiency levels of Tennessee students in fourth and eighth grades compared to the national average. Red arrows highlight shifts of noteworthy improvement. While Tennessee has outpaced national figures for proficient and advanced in 2015 –a direct result of the growth seen in the data above—58 percent of fourth-graders and 62 percent of eighth-graders remain below expected proficiency levels. Tennessee must double down on its efforts to improve student science performance.
A Formula for Success
Any way you slice the data, nearly all Tennessee students are showing improved academic performance in science—news worth celebrating. These data reinforce Tennessee’s efforts to improve teaching and learning, including investments in science, technology, engineering, and math (STEM)–based initiatives. Policies improving the rigor of standards, enhancing teacher evaluation, and expanding meaningful student learning experiences in preparation for postsecondary and career are no doubt reflected in these NAEP science results.
If there’s one takeaway from this data, it is that high expectations, combined with sound policy and courageous efforts can take you farther than all the rest. Here’s to Tennessee students’ continued rise as fastest improving in the nation!