
As Tennessee recovers from pandemic-related instructional and learning loss, state leaders must ensure that financial resources support higher student learning expectations and address urgent opportunity gaps. As attention turns to how districts will leverage federal recovery dollars, we have a new tool to understand the relationship between education resources, student opportunity, and outcomes: school-level per-pupil expenditure information.
Instead of poring through complex district budgets, relying on federally collected district-level data, or combing through the state’s Annual Statistical Report, Tennesseans can now see the average per-student amount spent at each school. This transparency provides a new layer of information as Tennessee continues assessing student outcomes during pandemic recovery.
Tennessee Insights Into School-Level Per Pupil Expenditures
In March 2021, the Tennessee Comptroller of the Treasury published a report describing how the Tennessee Department of Education (TDOE) collected and reported district- and school-level per-pupil expenditures. The Every Student Succeeds Act (ESSA) requires that state agencies gather and publicly display this information. Following TDOE‘s first public release of school-level data in June 2020, the Office of Research and Education Accountability developed an interactive dashboard with district and school expenditures plus a statewide interactive map to compare school-level expenditure data.
Tennessee Data Based On Funding Source
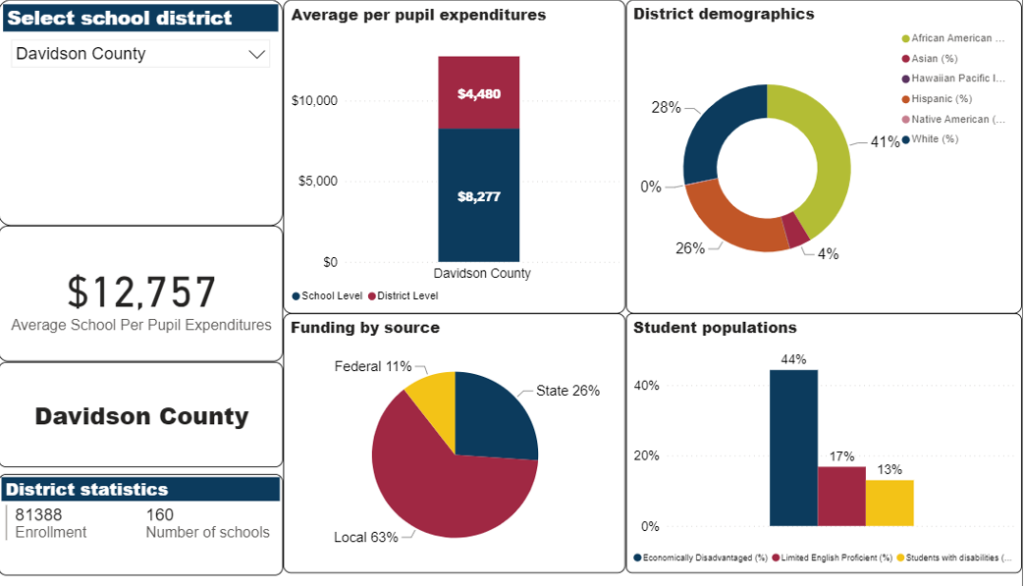
ESSA mandated that annual State Report Cards for public schools include “the per-pupil expenditures of federal, state, and local funds … disaggregated by source of funds, for each local educational agency and each school in the state for the preceding fiscal year.” In response, TDOE released data showing per-pupil expenditures for every public school during the 2018-19 year, calculated by adding school- and district-level expenditures together and then dividing by the number of students enrolled in each school.
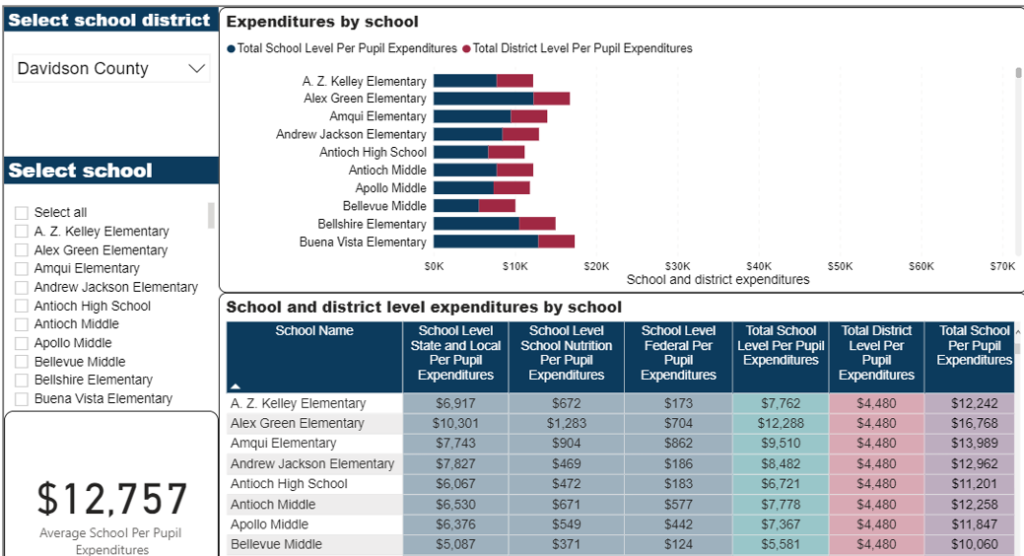
With an aggregate district view, the dashboard breaks down average per-pupil expenditures and gives additional student demographics. While this is more transparent than before, additional disaggregated information can reveal disparities related to student demographics. While a school with more economically disadvantaged students may have higher per-pupil expenditures than a school with fewer economically disadvantaged students, it is not clear if those resources are getting to students with the greatest need.
Comparing Per-Pupil Expenditures Of Schools Within A District
Districts use different methods to allocate funds across schools; some assign resources based on enrollment while others use a formula based on certain student populations (e.g., economically disadvantaged students). The comptroller’s report suggests it’s best to compare schools within one district. Given differences in student populations, districts’ capacity to raise funds, and how district- and school-level allocations are made, expenditures alone do not account for varied operating circumstances between schools. Detailed data on spending and student demographics are needed to draw accurate comparisons.
Tennessee’s Dashboard Compared To Other States
Reporting methods and data vary across the country, and Tennessee could learn from states like Hawaii and Illinois. Hawaii’s dashboard offers school- and state-level per-pupil expenditures disaggregated by state and federal funding, plus details on educator qualifications. Users can compare average educator qualifications at a state level between lowest poverty and highest poverty schools, providing insight on access to effective or qualified educators between low-income and high-income students – a well-documented driver of education inequity. Insights also are provided on school quality and student performance.
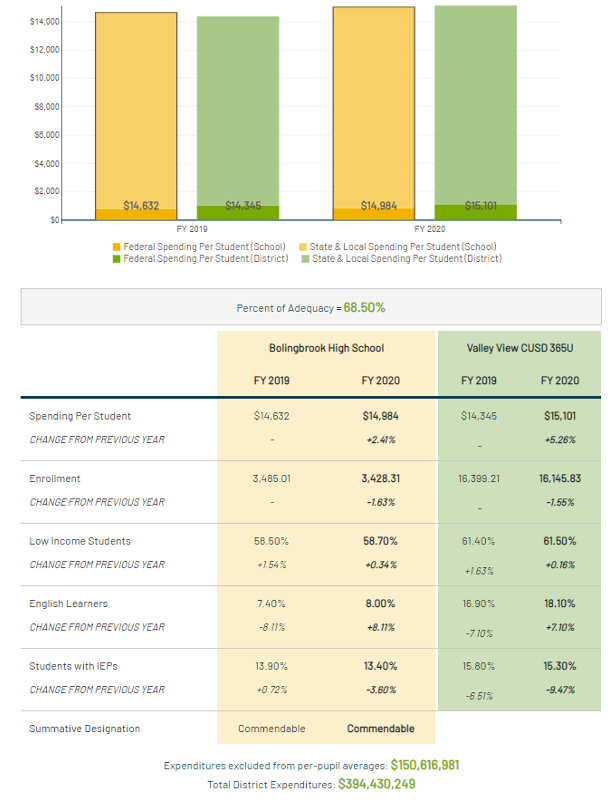
The Illinois dashboard features detailed school and student data at site and district levels, including:
- Evidence-based funding
- School- vs. district-level comparison of fiscal year spending per student
- Student demographic data
- Expenditures not included in per-pupil averages
- Funding source
The Illinois dashboard also includes teacher pay, retention, and education, as well as additional student and accountability data.
New Insights For Future Improvement
The release of this data and future insights can ground robust, evidence-based discussions around student needs and how schools and districts organize resources — key questions that can build stakeholder confidence through transparency. As regular operating funds are supplemented with federal education dollars, we can leverage initial — and over time, better — insights. By providing additional information going forward, TDOE can ground thoughtful discussions about resource allocation, student opportunity, and student outcomes.
Kevin Brown is a graduate fellow at SCORE. Peter Tang is SCORE’s director of research.
Read more: