Today the U.S. Department of Education released results of the 2015 administration of the National Assessment of Educational Progress (NAEP), also known as the Nation’s Report Card. Nationally, results demonstrate the reality that more concerted efforts are needed to advance student mastery of math, as well as reading. Many states’ results declined, while Tennessee held steady at its 2013 proficiency levels. Recognizing the substantial work needed nationwide to improve student math and reading proficiency, what do the NAEP data tell us about the state of education in Tennessee? Before answering this question, it is essential to understand a few points about the NAEP and how scores are reported.
What is the NAEP?
For decades, the National Center for Education Statistics has partnered with states to offer a rigorous assessment of how well students have mastered a variety of subject areas. Tests are administered periodically across grade levels and subject areas, but most regularly—every two years—in reading and math for grades 4 and 8. This year, 12,000 Tennessee fourth- and eighth-grade students took a no more than 90-minute NAEP test.
What do NAEP scores mean?
Subject area tests are scored on a scale of 0 to 500. Scores indicate whether students have mastered material at Below Basic, Basic, Proficient, or Advanced levels. Score cutoffs for these designations depend on the grade level and subject area of the test. Representative samples of students across the country enable states to compare how well their students are learning overall and compare their progress to that of their peers in other states. Achievement levels are defined as:
• Basic – partial mastery of prerequisite knowledge and skills that are fundamental for success in grade-level work.
• Proficient – demonstrated competency over challenging subject matter, including subject-matter knowledge, application of such knowledge to real world situations, and analytical skills appropriate to the subject matter.
• Advanced – superior performance.
How are Tennessee students performing on NAEP?
After making the largest NAEP score gains in history in 2013, Tennessee test-takers this year overall performed at comparable levels, even as their peers in many other states performed at lower proficiency levels. For the first time, Tennessee students are ranked in the top half of states in fourth-grade math, rising to 25th in the nation after ranking 46th just four years ago. These gains are worth celebrating. This year’s results also point the way toward areas of continued need for our state’s students.
Average overall scores in eighth-grade reading and math this year remained at their 2013 levels. The average score of 220 increased 1 point over 2013 in fourth-grade math, while it declined one point to 240 in fourth-grade reading.
Among our neighboring states in the South, only Mississippi students scored higher in fourth-grade math this year than in 2013. Scores declined in Georgia and Arkansas and remained at their 2013 levels in other bordering states. In eighth-grade math, scores declined in 22 states nationally, including Kentucky, North Carolina, and South Carolina. No state improved on eighth-grade math. Students improved their performance in fourth-grade reading in 13 states, including Kentucky, North Carolina, South Carolina, and Mississippi. Only West Virginia improved nationally in eighth-grade reading over the last two test administrations. Eight states declined on that test, including North Carolina.
Although overall scores and achievement levels for the state are important indicators of educational progress, a closer look at the data tell a more complete story of where gains have been made and where ongoing areas of need persist. Underserved students of color, English language learners, and students from urban school systems have historically underperformed on national assessments. Data from NAEP provide one perspective on efforts to improve education for these student populations.
Proficiency rates
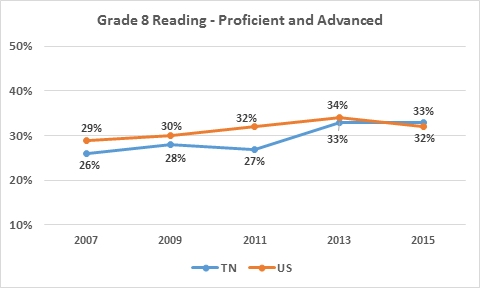
In 2007, only 29 percent of Tennessee fourth-graders scored in the proficient or advanced NAEP categories on math. This year, 41 percent did so. Tennessee’s eighth-grade rates of proficiency or above have narrowed the gap with national averages in math from 10 percentage points in 2011 to 3 percentage points this year. In reading since 2011, the gap has narrowed from 6 percentage points to 1 percentage point in fourth-grade. The eighth-grade reading gap between Tennessee and the national average proficiency rate grew between 2009 and 2011, but since then students in Tennessee have surpassed the national average.
To continue making progress toward national-level proficiency rates and to achieve those rates even above national averages, gains must be made across all student populations equitably. This work remains a compelling challenge for policymakers and educators statewide.
Racial performance gaps
Like their white peers, early grades African-American students in Tennessee have not made reading gains in recent years. After an 11 point gain between 2011 and 2013, black students declined 4 points this year in eighth-grade reading. In math, however, African American students from Tennessee have made substantial gains since 2007, as indicated in the graph below.
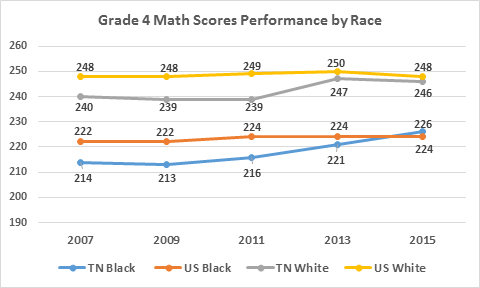
After lagging behind the national average math score of black fourth-graders through 2009, students in Tennessee have made gains in each of the last three NAEP administrations, surpassing the national average this year. As in eighth-grade reading and math, however, black student NAEP performance trails both the state and national white students’ scores by 20 points or more, demonstrating the urgent and ongoing need to address disparate educational outcomes for African-Americans.
As the Hispanic student population continues to grow in Tennessee and across the country, growing amounts of data will become available to track student progress from this subgroup as well.
Urban district growth
Across the country, large urban districts have made significant growth on NAEP over the last 12 years. This year again, urban schools gains have outpaced national performance. Students in urban Tennessee districts have reflected an improving trend in recent years. Since 2011, math scores for urban district students in fourth grade have increased 11 points. After a 14-point gain between 2011 and 2013, suburban fourth-grade math scores declined 4 points this year. Eighth-graders in urban Tennessee districts also continued gains in math and reading, as indicated by the graphs below. (For ease of reading, only scores for city and suburban locations are detailed.)
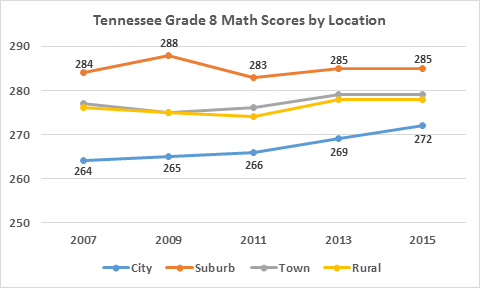
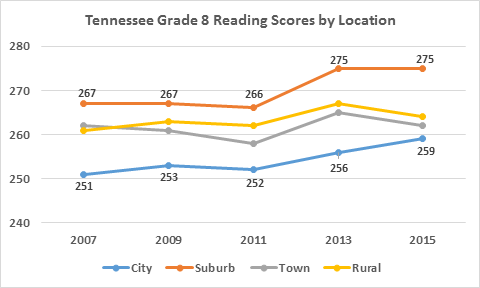
These gains should hearten educators in our state’s urban districts who are working to promote the equitable success of their students.
English language learners
As the English learner student population has grown in number over recent years, so too has its performance scores on NAEP assessments. After declining and remaining flat from 2011 to 2013 in reading and math, respectively, fourth-grade English learner students posted a 26-point gain in reading and a 17-point gain in math.
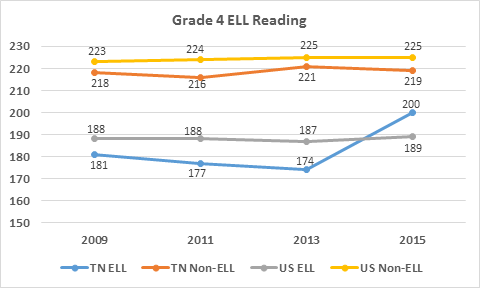

Because of the likely low sample size of English learners participating in NAEP, big point gains should be viewed cautiously. However, efforts to improve educational outcomes for this growing number of students have enabled them to now outpace the national ELL average performance and significantly narrow gaps with their peers for whom English is their first language.
Moving forward
In 2007, the U.S. Chamber of Commerce assigned an “F” for truth in advertising to Tennessee because of the discrepancy between high passage rates on state accountability exams and scores on NAEP. Low standards set by the state were reflected by low performance on rigorous national assessments. As Tennessee has enhanced the rigor of academic standards and moved toward aligning those standards with rigorous state assessments, students statewide have responded by succeeding at higher levels. Students in successive NAEP administrations have demonstrated higher levels of proficiency in math and reading, which bodes well for their success in high school and beyond. To realize a better prepared population of high school graduates, however, academic gains must be made for all of Tennessee’s students, particularly those in areas and subpopulations that have historically been underserved by the K-12 system.
A final word on interpretation: The Nation’s Report card is the best measure we have for comparing the performance of students in one state to those in other states and to national averages. Results also tell us, however, much about where to focus our energies and attention within our state’s borders. Today’s results require much further analysis, and as Matthew Chingos of the Urban Institute has demonstrated, NAEP data adjusted for demographic realities across states can lead to a variety of alternate interpretations.
For now, Tennessee must focus on continuing the work of improving instruction, equipped with student data and the tools to use them, and on the essential work of promoting greater educational equity across our public school system. Great teaching and strong support of student progress must remain among the state’s highest priorities, coupled with the assurance that the work we do here will continue to better prepare our students for the future.